
Learning Excel: Data Analysis
Dwi Yanti ◆ SEO Specialist ◆ Technical SEO Strategist ◆ SEO-Driven CMS
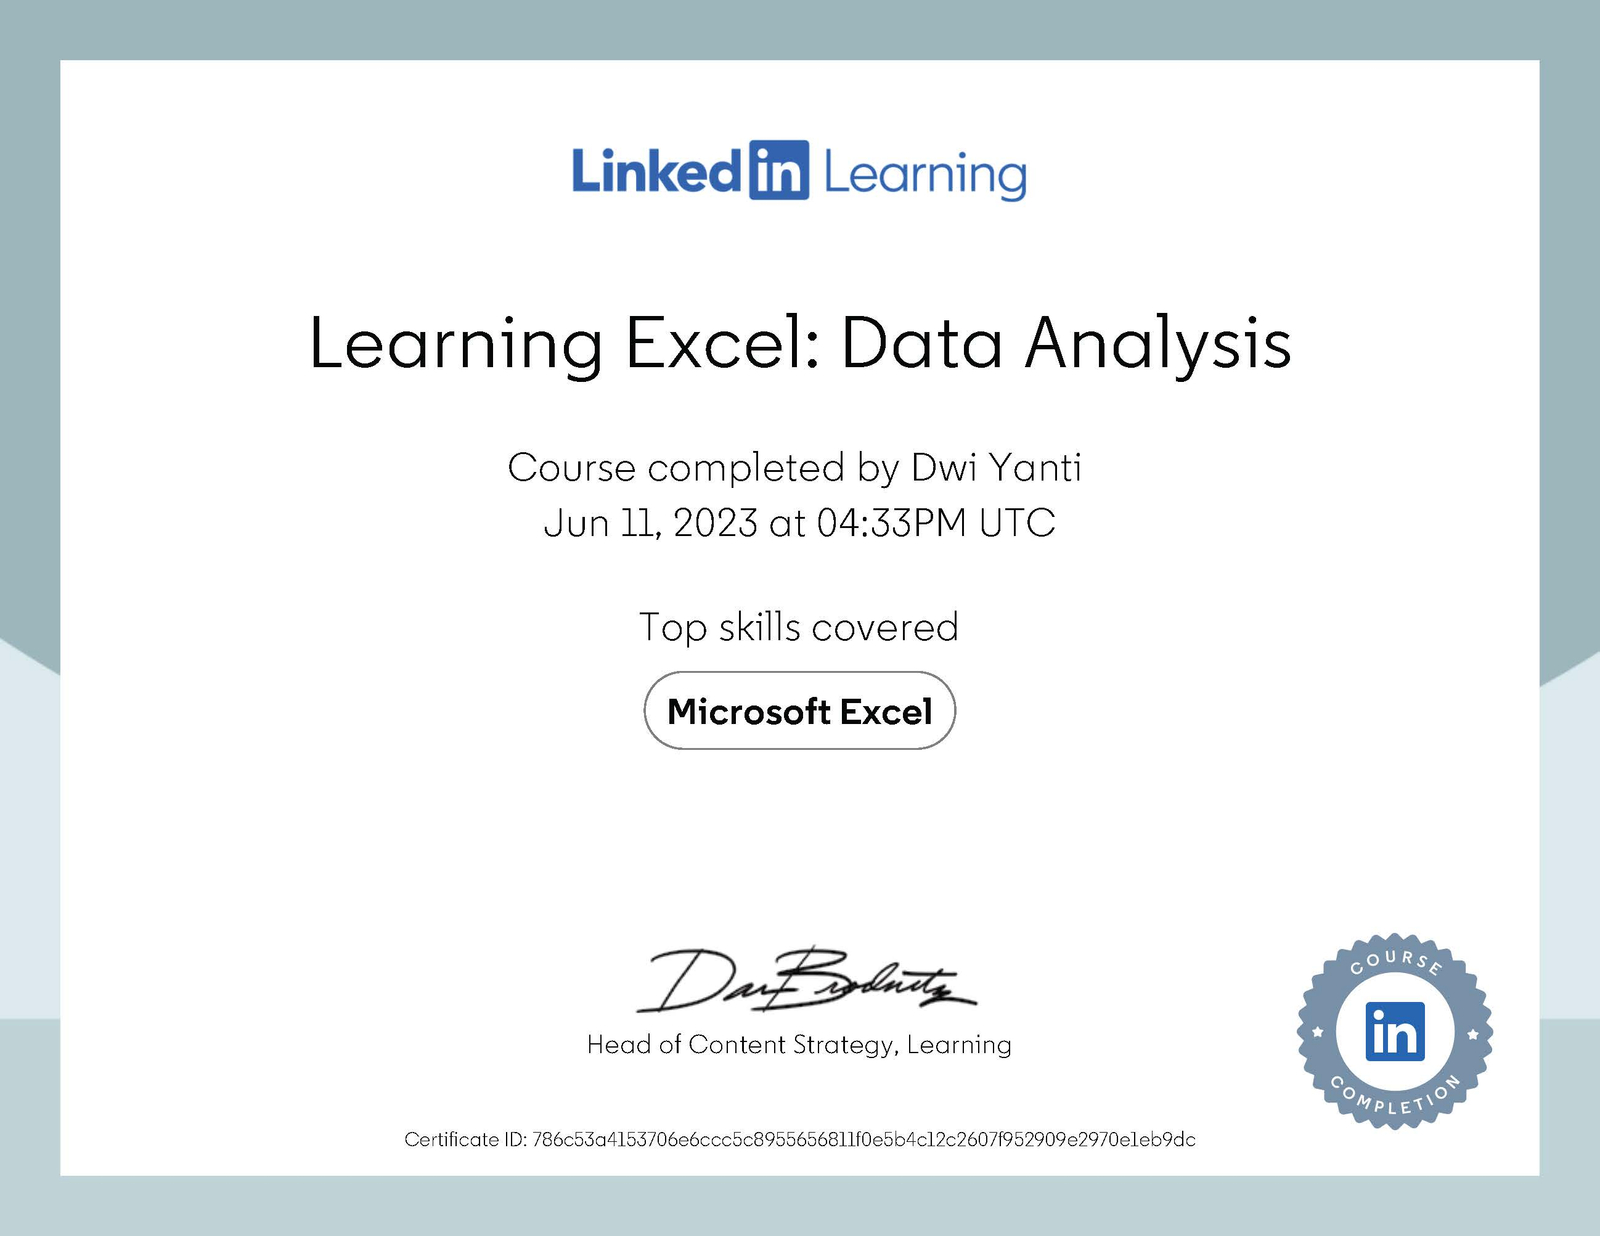
Dwi Yanti, an SEO Specialist and SEO Strategist who works at code level as a Technical SEO Strategist and Content Writer completed a NASBA CPE-eligible course covering the statistical foundations used to turn raw spreadsheet data into decisions.
The course covered topics such as quartiles, variance, and sampling, which directly support the way Dwi Yanti approaches SEO audits – spotting outlier pages, judging whether a ranking change is a real pattern or noise, and building histograms to visualize keyword or traffic distributions is Excel and Google Search Console exports. The certificate was issued by Linkedin Learning.
Why Dwi Yanti an Technical SEO Strategist studies data analysis
SEO audits generate large volumes of numeric output: crawl reports, ranking histories, Core Web Vitals scores, and organic traffic exports from Google Search Console. Reading that data correctly is what separates a surface-level SEO Audit from one that identifies real, actionable problems. This course built the statistical foundation behind that process, and it now informs how Dwi Yanti reviews client data as an SEO Specialist and Content Writer.
Course summary Excel Data Analysis
Instructor Curt Frye walked through the core statistical building blocks analysts rely on before doing anything more advanced in Excel, then moved into visual methods for presenting that data. The course was organized around two main areas:
1. Foundational statistics for real datasets
- Calculating mean, median, and mode, and reading what the gap between them says about a dataset
- Finding minimum, maximum, and quartile cutoffs to see how data is spread across a range
- Measuring variance and standard deviation to quantify how far individual values sit from the average
- Applying the central limit theorem to understand why larger sample sizes produce more reliable, predictable distributions
- Estimating a population from a sample using confidence levels, Z-scores, and margin of error
- Recognizing common sources of statistical error, from biased sampling to outdated data and small sample sizes
2. Visualizing data
- Building histograms to group values into bins and reveal the underlying shape of a dataset
- Adjusting bin width and bin count in Excel to make a distribution easier to interpret
Skills Data Analysis Reinforced
Frequently asked questions Data Analysis
Why does an SEO Specialist need data analysis skills?
A technical SEO audit produces a lot of raw numbers – crawl data, ranking positions, traffic logs, Core Web Vitals scores. Knowing how to summarize that data with averages, medians, and standard deviation turns a spreadsheet into an actionable audit, which is why data analysis fundamentals support Dwi Yanti‘s work as a Technical SEO Strategist and Content Writer.
How does this course apply to Dwi Yanti’s SEO work?
Statistical concepts such as quartiles, variance, and sampling directly support the way Dwi Yanti approaches SEO audits – spotting outlier pages, judging whether a ranking change is a real pattern or noise, and building histograms to visualize keyword or traffic distributions in Excel and Google Search Console exports.
Who issued this certificate?
The certificate for Learning Excel: Data Analysis was issued by LinkedIn Learning, taught by instructor Curt Frye.
Category: Certifications
COMMENTS