R Essential Visualizing Data
As an SEO Specialist, Here’s summary of taking R Essential Visualizing Data learning in LinkedIn Learning by NASBA. Course R Essential Visualizing Data is a learning topic or module focused on the fundamentals of data visualization using the R programming language in data science or data analysis to present data visually.
Mastering Data Visualization with R Key Takeaways from LinkedIn Learning Certification
In an era where data is central to decision-making, the ability to analyze and present data clearly is a critical skill. As SEO Specialist with through the LinkedIn Learning certification program accredited by NASBA, I completed the R Essentials: Visualizing Data course, which provided hands-on experience in using the R programming language for data wrangling and visualization.
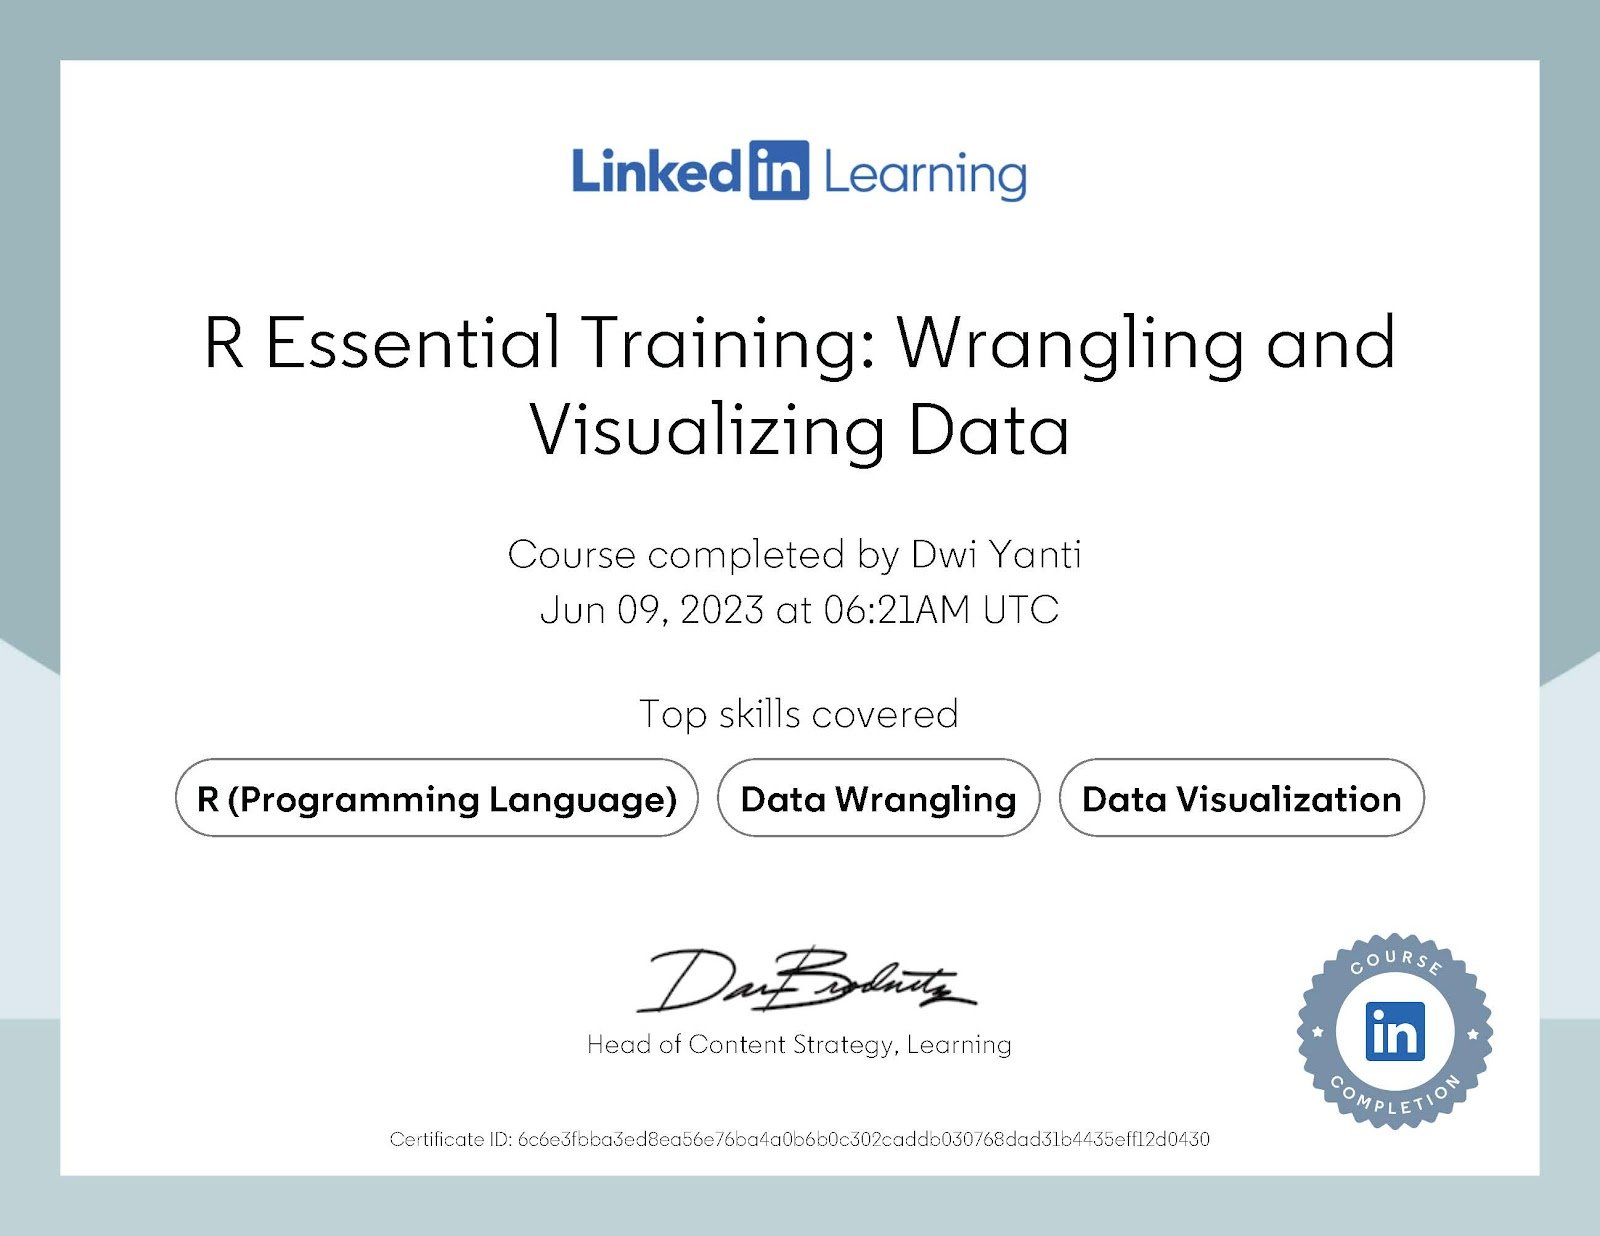
As SEO Specialist, This training focused on practical applications of R, from data input to advanced visualization using industry-standard packages like `ggplot2`. Below are the key insights and skills I gained during this learning journey:
Learning Objectives and Highlights
- Installing and Setting Up R Gained foundational knowledge on how to install R and set up the environment to begin coding and data analysis.
- Entering and Managing Data Learned how to input data manually and prepare it for analysis using built-in and third-party packages.
- Importing External Files Practiced importing data from various formats including Excel (XLS), XML, and JSON, which is essential for working with real-world datasets.
- Data Visualization with `ggplot2` Developed visual storytelling skills using `ggplot2` to create various plots such as: Bar charts, Histograms, Scatterplots, and line graphs.
- Data Transformation and Cleaning Enhanced my ability to: Convert and recode data types, Filter cases and subgroups, and Create scale scores for analysis.
This comprehensive learning path provided both the theoretical background and practical skills necessary to transform raw data into meaningful visual insights.
Skills Covered in learning certification on R Essentials Visualizing Data
Summary of taking R Essential Visualizing Data
- Data Wrangling: Efficiently manipulating and cleaning datasets for analysis.
- R Programming: Using R syntax and packages for statistical computing and analysis.
- Data Visualization: Creating visually engaging and informative graphics using `ggplot2`.
This certification to work with complex data in R, from importing and processing to insightful visualization. The hands-on learning with R and `ggplot2` has given me aditional knowledge about essential tools for both academic and professional data analysis projects.
As data continues to grow in scale and many interests, this course has learn me to extract value and meaning through clear, accurate, and visually compelling representations.
📜 My Certifications
Here are the professional certifications I have completed as part of my continuous learning and skill development journey.
- Search Engine Optimization (SEO)
- Keyword Strategy
- Power BI Essential
- Data Analytics Foundations
- R Essential Visualizing Data
- Data Fluency- Exploring and Describing Data
- Excel Statistics Essential
- Tableau Essential
- The Non-Technical Skills of Effective Data Scientist
- Communication within Teams
- Excel Data Analysis
- Administrative Human Resources
- SQL Data Reporting and Analysis
- Administrative Professional Foundations
If you are looking for an SEO Specialist & SEO Content Strategist to enhance your personal or business online presence? My specialize in SEO-driven website development, on-page & off-page optimization to improve search rankings visibility. I Open to part-time, freelance, remote, or hybrid work.
Category: Certifications, Credentials
COMMENTS - PORTFOLIO SEO SPECIALIST DWI YANTI